What is Standard Deviation?
Standard Deviation (SD) is the statistical measure of how spread out the values of a data set are from the mean or average number. In short, it measures the variation of the values from the mean.
The closer the values are to the mean, the lesser they are spread out, which also yields to a small SD. When the values are spread apart, that gives us a relatively large SD (See illustration below). Consequently, a small SD means more reliable data. Therefore, a large SD means less reliable data.

Before we discuss the formula, let’s first recall what Mean and Variance are. Mean is the average of the numbers in a data set, while Variance is the average of those numbers’ squared differences from the mean.
Related Reading: Mean Median Mode – Measures for Data Sets
Population Standard Deviation
To compute the Population Standard Deviation, you must find the square root of Variance, which is expressed in the formula:
SD = √[∑(xᵢ – x̅)² / N]
Where:
SD = Population Standard Deviation
∑ means “the sum of”
N = Number of data points in the population
xᵢ = Each value from the population
x̅ = The population mean

To sum up, here are the steps to determining the Standard Deviation of a population:
Step 1. Compute the population mean (x̅) by adding up all the values in the population (xᵢ) and dividing the sum buy the population’s size (N).
Step 2. Subtract the mean from each value, as expressed in xᵢ – x̅.
Step 3. Then, square each of those differences.
Step 4. After that, compute the mean of those squared numbers from the previous step. Here, the resulting number is also the Variance.
Step 5. Finally, find the square root of the Variance and you’ll have the Population Standard Deviation.
Sample Standard Deviation
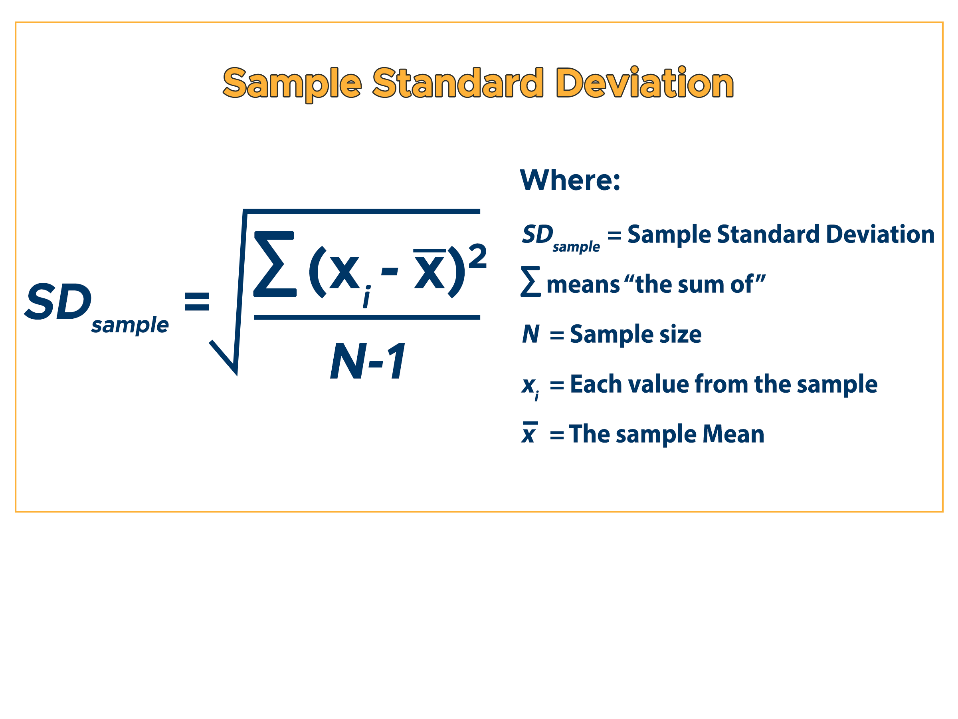
In short, the formula for Sample Standard Deviation is almost the same as that of population. The only difference is the N-1 instead of just N.
SDsample = √[∑(xᵢ – x̅)² / (N – 1)]
Where:
∑ means “the sum of”
SDsample= Sample Standard Deviation
N= Number of data points in the sample
xᵢ = Each value from the population
x̅ = The sample mean
Example #1: Population
Find the standard deviation of the following population values: 3, 5, 6, 4, 2.
Step 1. Firstly, compute the mean or average.
(3 + 5 + 6 + 4 + 2) ÷ 5 = 4.
Step 2. Then, subtract the mean (x̅ = 4) from each value (xᵢ) . To clarify, let’s set up a table to see the computation better. Therefore, proceed to Step 3 and square the differences of each value and the mean.
| xᵢ | x̅ | Step 2: xᵢ-x̅ | Step 3: (xᵢ-x̅)² |
| 3 | 4 | -1 | 1 |
| 5 | 4 | 1 | 1 |
| 6 | 4 | 2 | 4 |
| 4 | 4 | 0 | 0 |
| 2 | 4 | -2 | 4 |
When plugged into the formula, this is how the values look:
SD = √[∑(xᵢ – x̅)² / N]
SD = √[(3 – 4)² + (5 – 4)² + (6 – 4)² + (4 – 4)² + (2 – 4)² / 5]
Substitution is another way to solve for standard deviation, but you can always use the table method for convenience.
Step 4. Then, determine the mean of the differences from Step 3.
(1 + 1 + 4 + 0 + 4) ÷ 5 = 2. Therefore, the Variance is 2.
Step 5. Finally, find the square root of the Variance to determine the SD.
SD = √2 ≈ 1.414
Therefore, the Standard Deviation of the Population is ≈1.414.
Example #2: Sample
Find the standard deviation of a sample population with the following values: 9, 6, 5, 7, 4, 2.
Step 1. Firstly, find the sample mean.
(9 + 6 + 5 + 7 + 4 + 2) ÷ 6 = 5.5
Step 2. Subtract the sample mean (x̅ = 5.5) from each value then square each of their differences.
| xᵢ | x̅ | xᵢ – x̅ | (xᵢ – x̅)² |
| 9 | 5.5 | 3.5 | 12.25 |
| 6 | 5.5 | 0.5 | 0.25 |
| 5 | 5.5 | -0.5 | 0.25 |
| 7 | 5.5 | 1.5 | 2.25 |
| 4 | 5.5 | -1.5 | 2.25 |
| 2 | 5.5 | -3.5 | 12.25 |
Step 3. Then, calculate the mean of the squared differences by adding them all up and dividing them by the number of the sample minus 1 (N-1), not just N. Remember that we’re working on a sample population, thus the formula changed.
(12.25 + 0.25 + 0.25 + 2.25 + 2.25 + 12.25) ÷ (6 – 1) = 5.9
Therefore, the Sample Variance is 5.9.
Step 4. Finally, find the square root of the Sample Variance to determine the Sample SD.
SDsample= √5.9 ≈ 2.428
Therefore, the Sample Standard Deviation is ≈ 2.428.
Thank you for reading. We hope it’s effective! Always feel free to revisit this page if you ever have any questions about standard deviation.
Check out some of our other blog posts or invest in your future with one of our self-study courses!